Some say, just follow the Aid to Navigation (ATONs). Others say pay more attention to the chart. Others have favorites like SonarChart from Navionics. The surveys from USACE are also popular to follow. Then there are the crowdsourced data from Waterway Guide and Active Captain. There are also many guide books, including my own ICW Cruising Guide. The choices can be bewildering, there are so many. I've collected a list so you can decide for yourself what to use.
Charts
First, let's address definitions so we have common ground. A chart can be on a chart plotter, a tablet (e.g., iPad), or paper, it doesn't matter as far as accuracy if they are all up to date and viewed at the proper zoom level. National Oceanic and Atmospheric Administration (NOAA) develops and maintains for free use the coastal charts for the US, updated every seven days. Not every chart is updated, only the ones with changes, perhaps 10 to 15%. Even then, the changes usually affect only small areas of the updated chart, most areas are the same. How those updated charts find their way into navigation programs and apps vary between the providers.
.jpg?alt=media&token=fe24070e-d826-40b2-9897-f6f0e7fa3b9d)
The chart above is the familiar paper chart, called a Raster Navigation Chart (RNC) by NOAA of the area around Stonington, Connecticut directly off the NOAA ENC viewer site at no charge. It used to be the standard of the charting industry but it's going the way of the dinosaur. Cancellation of all traditional paper and associated raster chart products will be completed by January 2025. Per NOAA's explanation, digital updates are easier, quicker, and increase mariner safety. Electronic Navigation Charts (ENC) which are available now for downloading (also at no charge) and will be the only charts available from NOAA after 2025.
.jpg?alt=media&token=9b634c3b-ea25-43a7-841e-a6070a85e317)
The chart above is of the same area near Stonington, Connecticut but in ENC format off the NOAA ENC viewer site. With free NOAA charts available, why would you want charts from apps such as Aqua Map or Navionics? Well, take a look at the same area as displayed in the Aqua Map app. Compare all three charts and decide for yourself which one you would prefer to navigate by. Note that the Aqua Map chart shows numbers on the buoys, Waterway Guide points of interest, tides and currents, and more. Navionics chart products add similar detail but do not include Waterway Guide points of interest or USACE survey charts, more on that later.
.jpg?alt=media&token=61e85acb-69b4-44dd-9ed9-e0412cb45721)
It takes some effort to convert the ENC chart data from NOAA into a format more easily interpreted by navigators, hence the charge for proprietary charts. Aqua Map only charges $14.99 per year for the entire US and Canada. Navionics doesn't charge much more. Some navigation apps such as iNavX or SEAiq will display the ENC charts from NOAA for free once you buy their app. Both apps read the raw NOAA chart catalog and after an update (press a button), your charts will be to the same level as on the NOAA site. Charts other than NOAA's are available for an additional price from each app.
Now that you've seen examples of all three formats, decide for yourself which format you want to use for navigation.
US Coast Guard (USCG) ATONs
.jpg?alt=media&token=fbbe65fc-6375-4ad5-81fe-fbb93dfe5928)
ATONs is short for Aids To Navigation and they are maintained by the US Coast Guard (USCG). Most of the weekly corrections to the NOAA charts are for changing ATON positions, new, or destroyed ATONs. One might think that ATONs would be more accurate than the charts since it's the charts that are being updated, not the ATONs which have already been repositioned by the USCG. However, there are many places where there are no ATONs and the charts can be useful for staying centered in a narrow channel or when crossing an area with strong currents. There are also cases where the ATONs will lead you into shallow water. I would expect that to eventually be corrected but the USCG has a huge workload and can't always move or add every buoy as needed. I will cover all this in more detail later with examples.
Look closely at the sample chart, do you see where a red buoy is marked with a yellow square? That means to treat that particular red buoy as a green buoy for purposes of navigating the ICW, i.e., pass it to port going from right to left in the chart above. Likewise, for where a green buoy has a yellow triangle, it's to be treated as a red buoy. The examples cited often arise when passing by inlets along the ICW, be diligent in looking for the yellow squares and triangles to be sure you're taking the right course.
US Army Corp of Engineers (USACE) Depth Surveys
.jpg?alt=media&token=79c60638-c1e2-4bdb-811d-3509011c3fd6)
Other sources of charts are the surveys taken by the USACE all over the country. Many districts have survey boats that pass through the areas of their responsibility and take soundings to a resolution of 1 ft as in the above example near Beaufort, North Carolina. The soundings are published and available for everyone to use at no charge.
The Wilmington USACE will survey the inlets as often as needed, sometimes multiple times a month such as at Shallotte and Lockwoods Folly, and even publish recommended routes through the shallows. It is invaluable information and Waterway Guide includes the most recent soundings in the form of a chartlet in the alerts for each area. Other USACE districts survey less often. You can download PDF versions of the surveys from Wilmington and Charleston but not from some other districts. All data is uploaded to a database called eHydro which Aqua Map accesses to produce charts like the one below of the same area for comparison purposes.
.jpg?alt=media&token=fca48674-6078-4293-b178-5c407cd2c9d6)
Crowdsourced Data
Waterway Guide and Active Captain are the two biggest collectors of crowdsourced data. Both can be useful in avoiding shoaling areas as well as general information about marinas, anchoring, and other items of interest. Active Captain accepts all inputs as is but Waterway Guide editors examine the input for accuracy before including it in their database. An input like, "Came through, no problems" is not particularly informative and we've all skipped over such reviews when reading Active Captain posts and maybe even looked for a post by Bob423.
For Waterway Guide Alerts, an editor, often an on the water editor (me for the ICW), will contact the boater for more information on the depth readings, tide level, depth of keel, etc. to make the post more useful and roll the results up into a unified guidance post at the beginning of the hazard alert. I maintain the Waterway Guide alerts for portions of the AICW so I look first at the latest information from that source since I know it will be up to date and as accurate as I can make it. I access many sources in deciding the best way to negotiate a shallow area. Below is a sample Waterway Guide Alert for Lockwoods Folly in North Carolina.
.jpg?alt=media&token=34147cdb-5a23-4d9f-bf42-4df0124f4e10)
The great advantage of crowdsourced data is immediacy. If it's up to date, it can be what is "happening right now" and can be in advance of NOAA or ATONs position updates and even USACE surveys. However, it's only as good as user inputs and user accuracy so it has limitations.

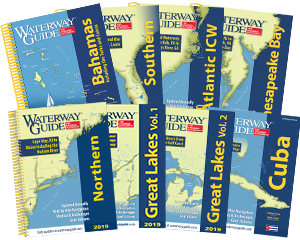
- 4,000 Marinas
- Thousands of anchorages
- Updated Charts
- Mile-by-Mile Navigation
- Highlighted Alerts & Cautions
- Full-Color Aerial Photographs
The Waterway Guide App Makes it easy to leave reviews, use our explorer, and view waterway guide materials all on the go!